

Content Tree
Content for Story Board slides is literally "pulled" from Data Discovery reports designed in the Data Discovery analytic environment. The Content tree in the Story Board designer is a basic folder interface for finding relevant Data Discovery analytic books and then finding relevant reports within those and books. Once you have the reports you wish to use, content can be added to the slide canvas through a simple drag-and-drop exercise.
The content that is available includes content that has been published from Power BI Desktop to BI Office, as well as Power BI Desktop files (*.PBIX) that have been imported from within BI Office.
Book Trees
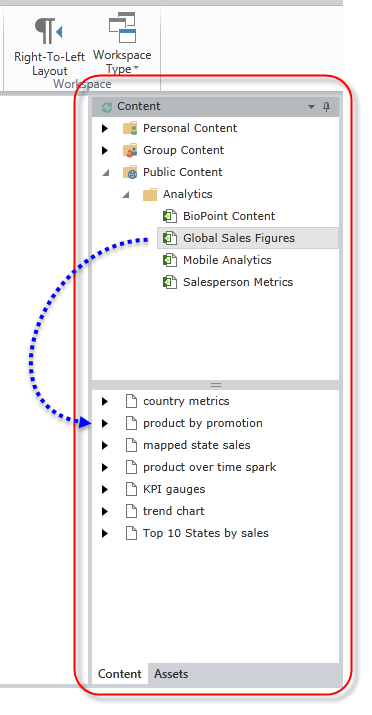
The content tree is normally positioned on the right hand side of the designer interface. In the image below, the listing of books that the user can access is provided in the top panel of the content tree.
The various folders and books that a given user can see are determined by the user's access to content like all other parts of the application. Users can traverse the content trees of folders to find the books that they wish to use as content sources for the dashboard.
Clicking on a book will load its report contents into the bottom Report Tree below the Book Tree.
Report Tree
The report tree exposes a hierarchical listing of reports (and folders of reports) as they currently exist in the selected Data Discovery book. If the content is from Power BI, the listing will show the separate components of a given report.
Adding Story Board Content
To add reports to a slide canvas, users can either:
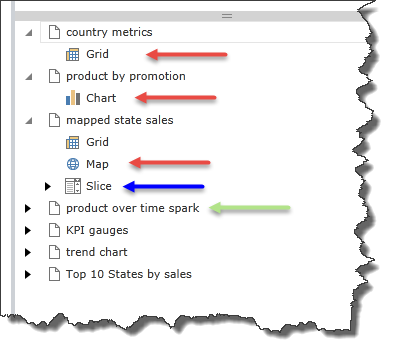
- Click on the report name and drag it onto the canvas directly (green arrow above).
- By default, all of the report's original contents and layout will be copied WHOLE into the canvas (or canvas panel).
- Alternatively, users can use the prompt dialog to select specific elements to add to the canvas
- Open up the report node, and select specific reporting components to add to the canvas (red arrows above).
- Only the specifically selected component will be copied to the canvas (or canvas panel).
NOTE: Slices appear as sub-nodes in the tree (blue arrow). Users can elect to include all slicers by selecting this node or expanding the node and selecting a specific slice to add to the canvas.
Dynamic Text Content in Story Boards
Static and Dynamic text can be added to story boards. Dynamic text formulations and artifacts generated in Data Discovery can be added to the slide canvas like all other objects like grids, charts and maps. Like these other items, interactions can be set to them and they will reflect user based interactivity with the running story board. The text tab allows designers to tweak the original dynamic text objects imported from Data Discovery.
Editing or Removing Story Board Content
See details on content management in the Slide Canvas help topic.
Home |
Table of Contents |
Index |
User Community
Pyramid Analytics © 2011-2022